What the Cell
D4.3

Climate change

2 hours8 statementsTextbook pp. 820–833

Guiding questions

  1. What is driving climate change?
  2. How does climate change affect ecosystems?

Slides

Slide 1 of 13

Notes

Written for this site from the class slides, with textbook page references for each statement. The chapter is on pages 820–833 of the course textbook. Image credits are on slide 13.

Causes and feedback

D4.3.1

Human causes of climate change

pp. 820–824

Human activity has raised atmospheric carbon dioxide, mainly through burning fossil fuels and deforestation, and methane, for example from ruminants, rice fields and landfill. These gases absorb long-wave radiation and warm the atmosphere.
D4.3.2

Positive feedback

pp. 825–827

In a positive feedback, warming causes changes that lead to more warming. Examples are carbon dioxide released from the deep ocean, more solar radiation absorbed as snow and ice are lost, faster decomposition in thawing permafrost, and more droughts and forest fires.

Watch out: positive does not mean good. It means the effect increases the original change.

D4.3.3

Boreal forests as a tipping point

pp. 827–828

Warmer temperatures and less winter snow bring more drought, and primary production falls in the taiga. Forests turn brown and die back, so they may change from accumulating carbon to losing it.

Effects on ecosystems

D4.3.4

Melting ice changes polar habitats

p. 829

Early break-up of Antarctic landfast ice threatens the breeding grounds of emperor penguins. Loss of Arctic sea ice removes the resting places of Pacific walruses.

D4.3.5

Ocean currents and upwelling

pp. 829–830

Warmer surface water can prevent upwelling of nutrients. This changes its timing and extent, reducing primary production in the ocean and the flow of energy through marine food chains.

D4.3.6

Range shifts

pp. 830–831

Species are moving upslope and towards the poles. On two mountains in Papua New Guinea, the upper limits of bird species moved up by about 110 to 150 m between the 1960s and 2012–13. Ranges of tree species in North America are contracting in the south and spreading north.

D4.3.7

Threats to coral reefs

p. 832
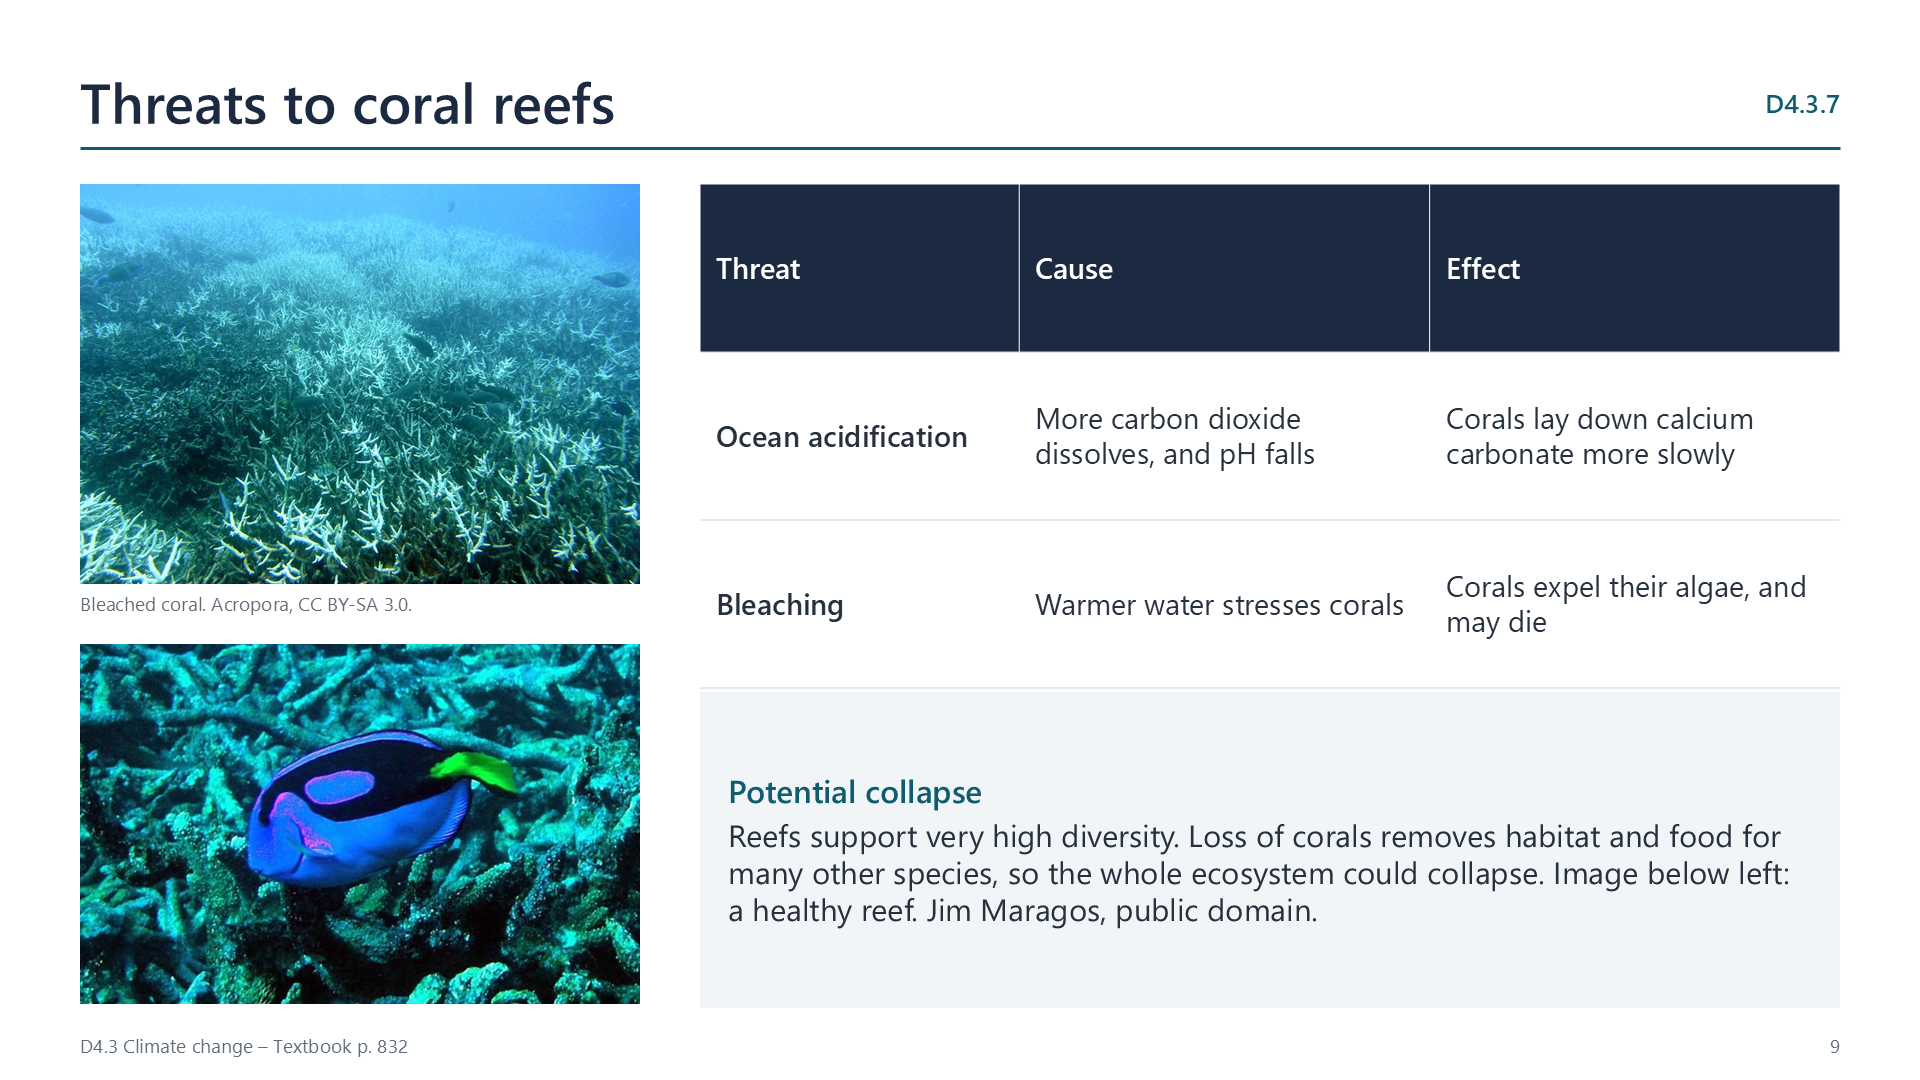
Slide: bleached and healthy coral, with a table of threats

More dissolved carbon dioxide causes ocean acidification, which suppresses calcification. Warmer water causes bleaching, as corals expel their algae. Reefs cover less than 0.1% of the ocean yet hold about a quarter of marine species, so their loss could cause the ecosystem to collapse.

Response

D4.3.8

Capturing carbon

p. 833

Approaches include afforestation, forest regeneration and restoring peat-forming wetlands. Hinewai Reserve in New Zealand is an example of rapid regeneration after degradation. Use a local peatland as a second example.

Videos

Select a video to play it here. Select it again to close it.

Note-taking sheet

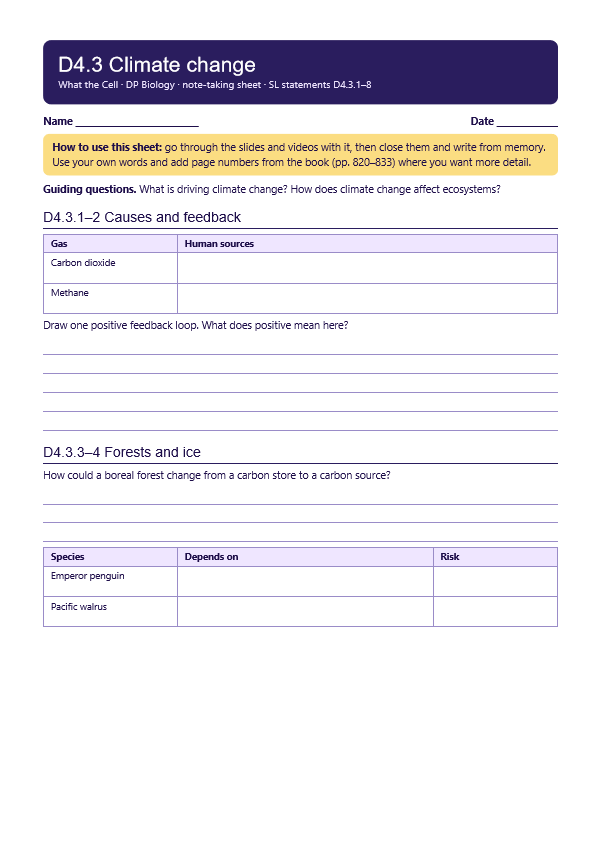
Print this guide and complete it as you work through the slides and videos. It asks for your own explanations, so close the notes while you try each section.

First page of the note-taking sheet

Quick self-check

The self-check needs JavaScript to run.

Practice questions

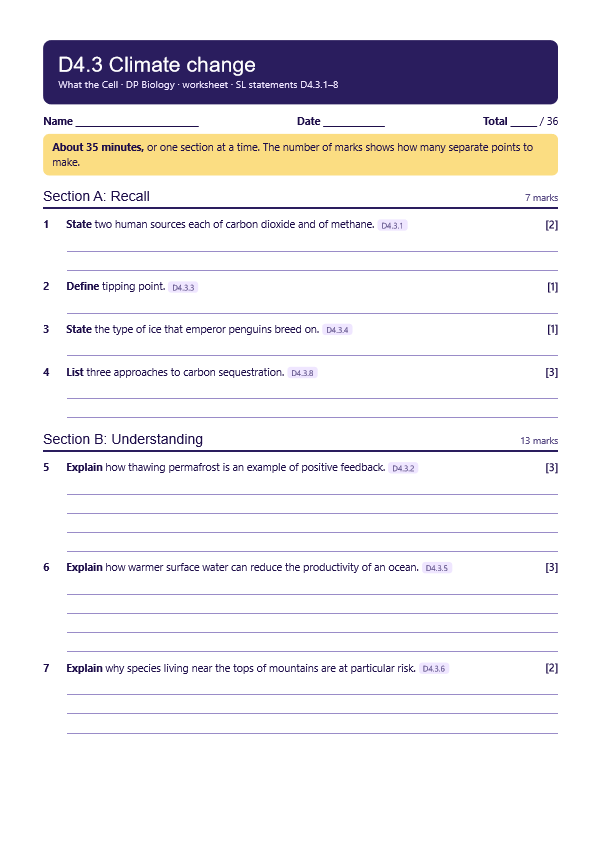
A printable worksheet covering all eight statements, from quick recall to data questions and a longer answer. It has 36 marks and takes about 35 minutes, or you can do one section at a time.

Your teacher has the mark scheme.

First page of the worksheet

Data-based questions

Questions built on realistic experimental data, in the style of Paper 1B and Paper 2. Work them on paper and show your working. 13 marks in total. Your teacher has the mark scheme.

Warm water and coral disease

7 marks
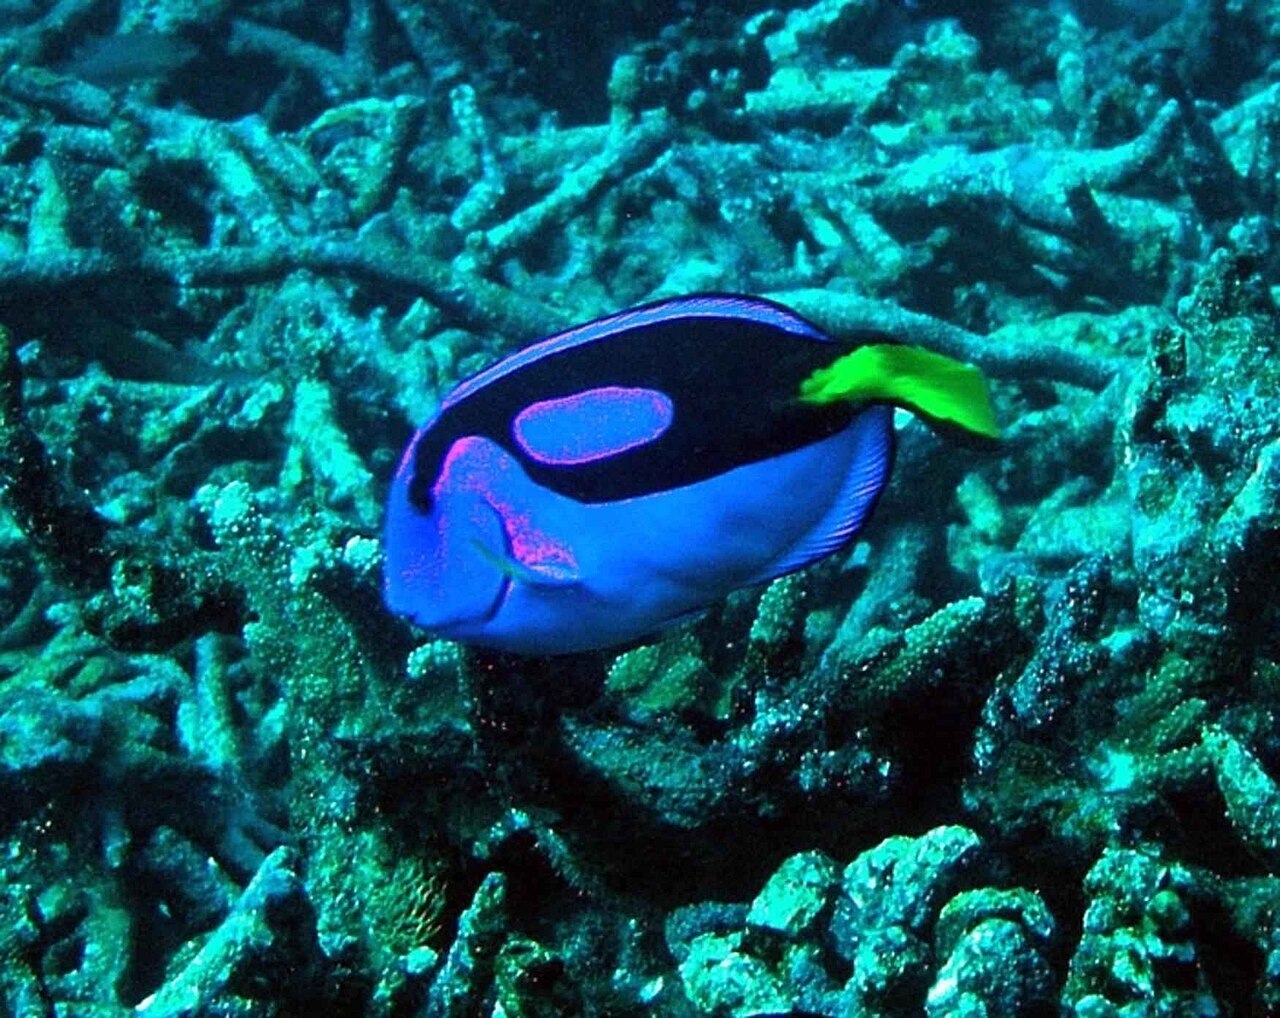
A coral reef
Image: Jim Maragos, U.S. Fish and Wildlife Service, Public domain, Wikimedia Commons.

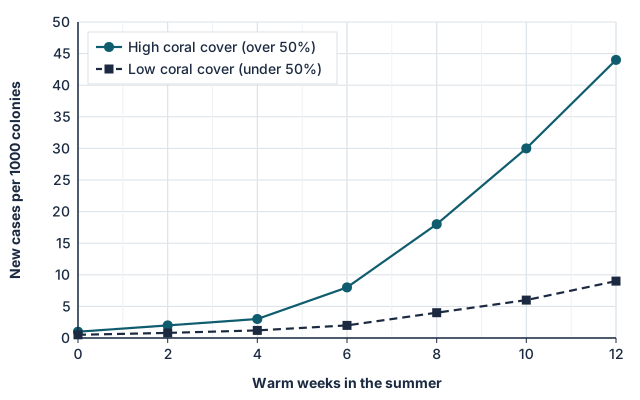
White syndrome is an infectious disease that kills coral tissue. Over six years, scientists surveyed reefs on the Great Barrier Reef. Each summer they counted the number of weeks in which the sea was at least 1 °C warmer than normal ("warm weeks"), and the number of new cases of disease per 1000 coral colonies. Reefs were grouped by coral cover.

Line graph of new disease cases per 1000 colonies against warm weeks. Reefs with high coral cover stay low until about 5 warm weeks, then rise steeply to 44 at 12 weeks. Reefs with low coral cover rise slowly to 9.
  1. Identify the number of warm weeks below which disease stays low on reefs with high coral cover. [1]
  2. Compare the results for reefs with high and low coral cover. [2]
  3. Suggest why disease spreads more where coral cover is high. [1]
  4. Suggest two other effects that rising carbon dioxide levels could have on coral reefs. [2]
  5. State one advantage of a field study like this compared with experiments in tanks. [1]

A warming Antarctic sea

6 marks

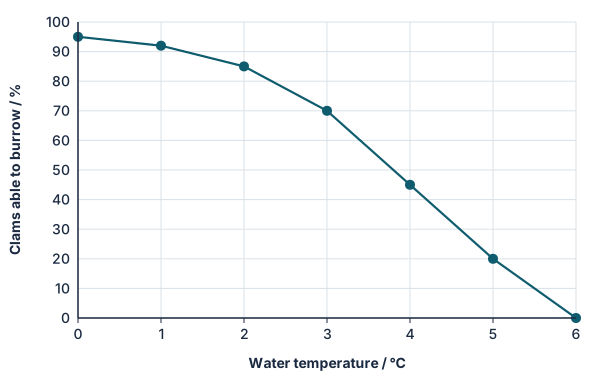
The Antarctic soft-shell clam (Laternula elliptica) lives buried in mud on the sea bed, where the water is normally about 0 °C. Clams were kept at different temperatures for two weeks, then placed on mud, and the percentage that could bury themselves was recorded.

Line graph of clams able to burrow: 95% at 0 degrees, 92 at 1, 85 at 2, 70 at 3, 45 at 4, 20 at 5 and 0 at 6.
  1. Estimate the temperature at which half the clams can burrow. [1]
  2. Suggest why no clams can burrow at 6 °C. [1]
  3. Less oxygen dissolves in warmer water. Explain how this could add to the effect of temperature on the clams. [2]
  4. Some Antarctic waters have warmed by about 1 °C in 50 years. Discuss the long-term survival of this species. [2]

Practical

Modelling heat trapping by carbon dioxide

Model40 minD4.3.1

You will need: Two identical clear bottles, thermometers or probes, lamp, vinegar and sodium hydrogen carbonate

  1. Fill one bottle with carbon dioxide from vinegar and sodium hydrogen carbonate
  2. Seal both bottles around a thermometer, at equal distances from the lamp
  3. Record temperatures every minute for 15 minutes
  4. Evaluate how well this small model represents the atmosphere

Safety: Eye protection. Lamps get hot. Keep bottles open while generating gas, to avoid pressure build-up.

Carry this out with your teacher's supervision and follow your school's lab rules.

Nature of science and TOK

Syllabus statements

Summarised in our own words. Use each code to find the exact wording in your textbook or the IB subject guide.

  • D4.3.1How human activity causes climate changep. 820
  • D4.3.2Positive feedback in global warmingp. 825
  • D4.3.3Boreal forests switching from storing carbon to losing it, as a tipping pointp. 827
  • D4.3.4How melting landfast ice and sea ice change polar habitatsp. 829
  • D4.3.5How altered ocean currents change when and how much nutrient upwelling happensp. 829
  • D4.3.6Temperate species shifting their ranges towards the poles and uphillp. 830
  • D4.3.7Threats to coral reefs as a possible case of ecosystem collapsep. 832
  • D4.3.8Capturing carbon through afforestation, forest regeneration and restoring peat wetlandsp. 833

HL extension

© 2026 Akash Parthi Bendran. Please ask before using or sharing any resources from this site: see permission to use.